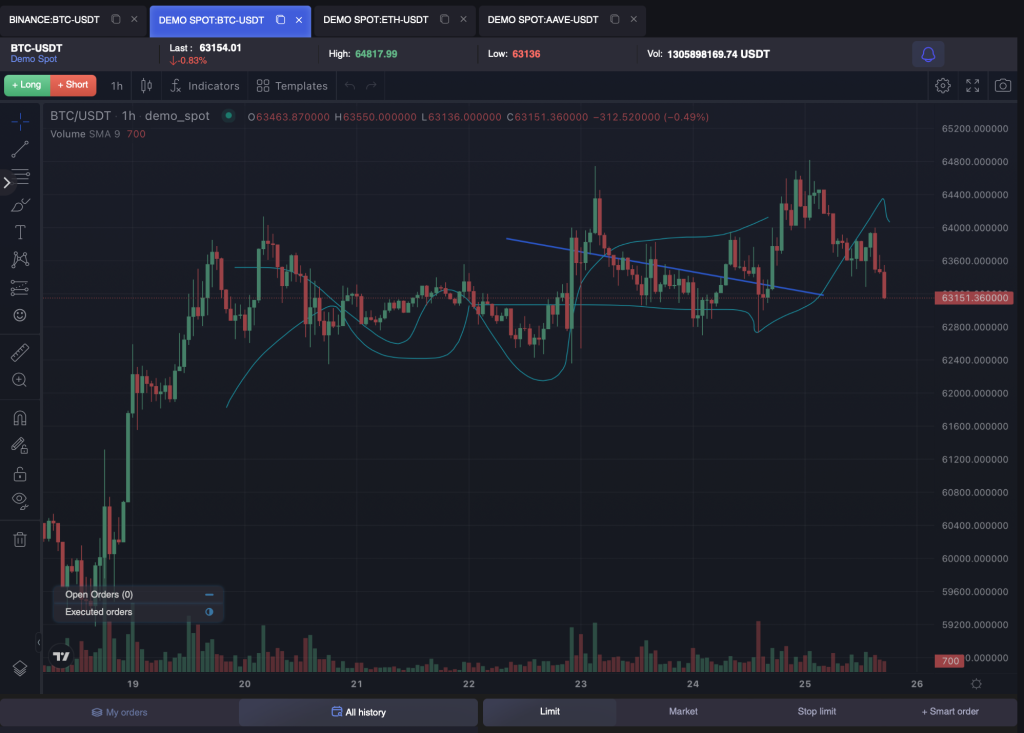
The chart workspace can be zoomed in as other terminal tabs can be collapsed.
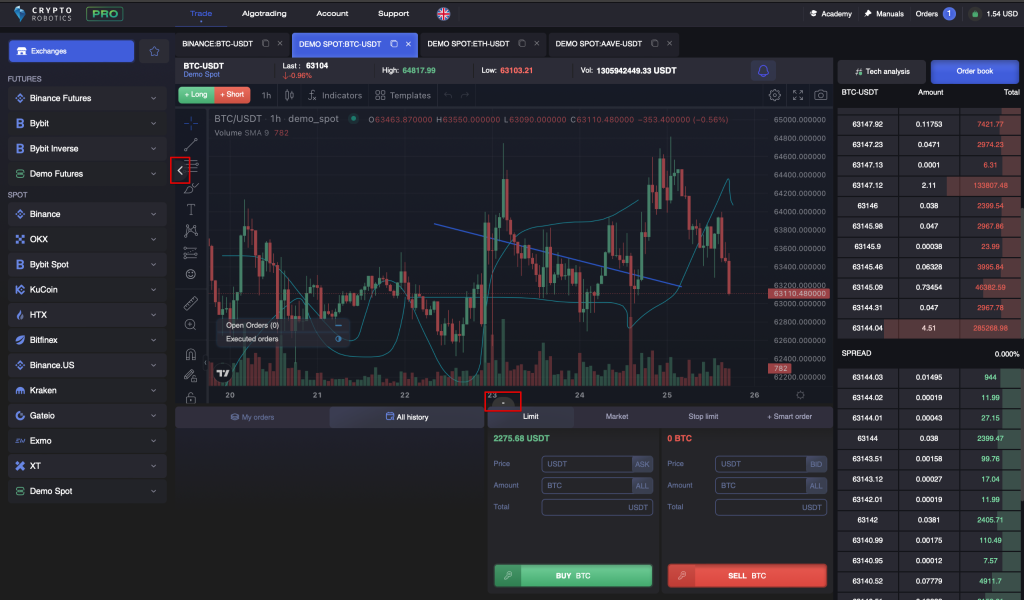
Each tab can be collapsed separately or all at once.
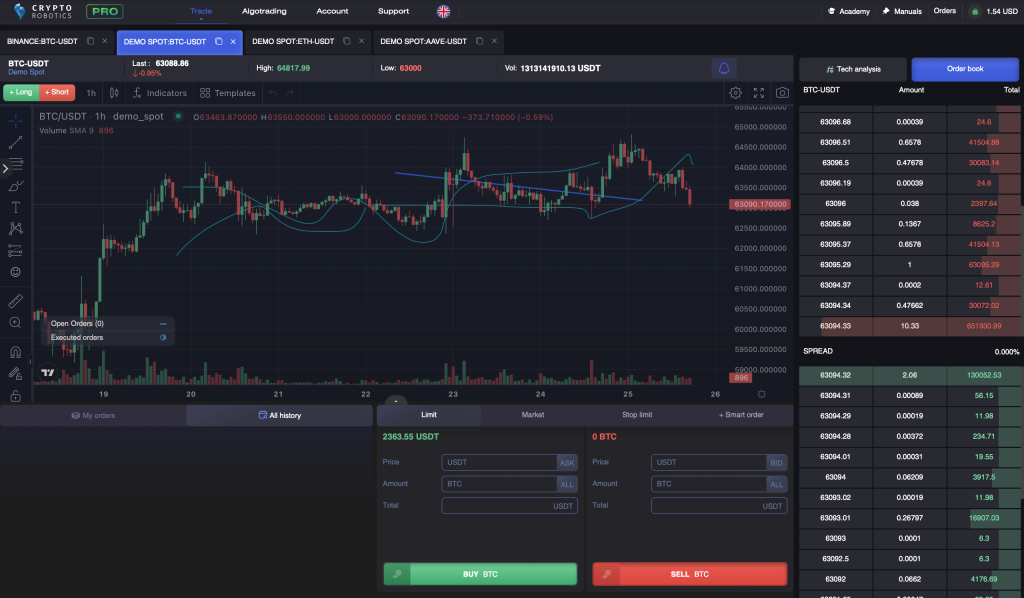

You can open the chart full-screen as well by clicking on the icon in trading pair tab.

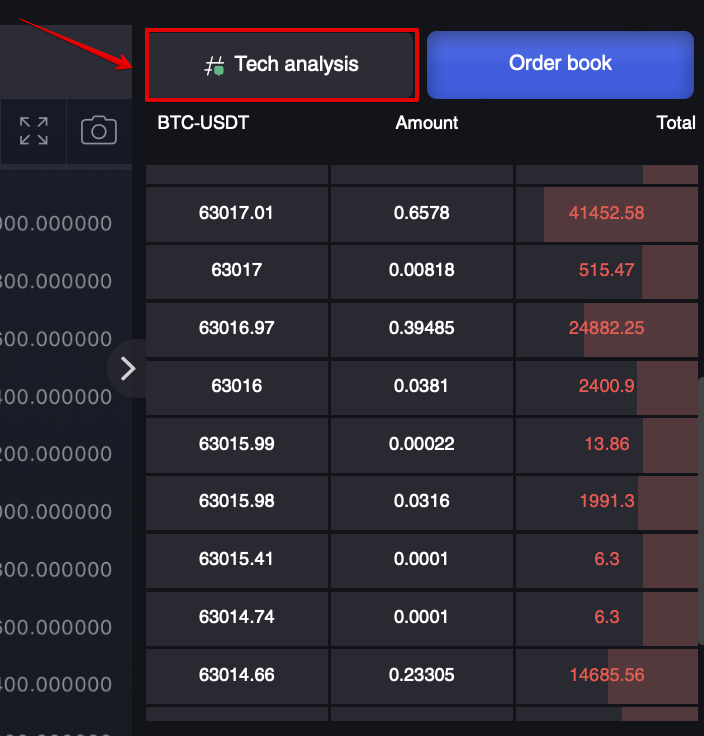
After bottom bar with orders is collapsed you can see the additional button in the upper right corner.
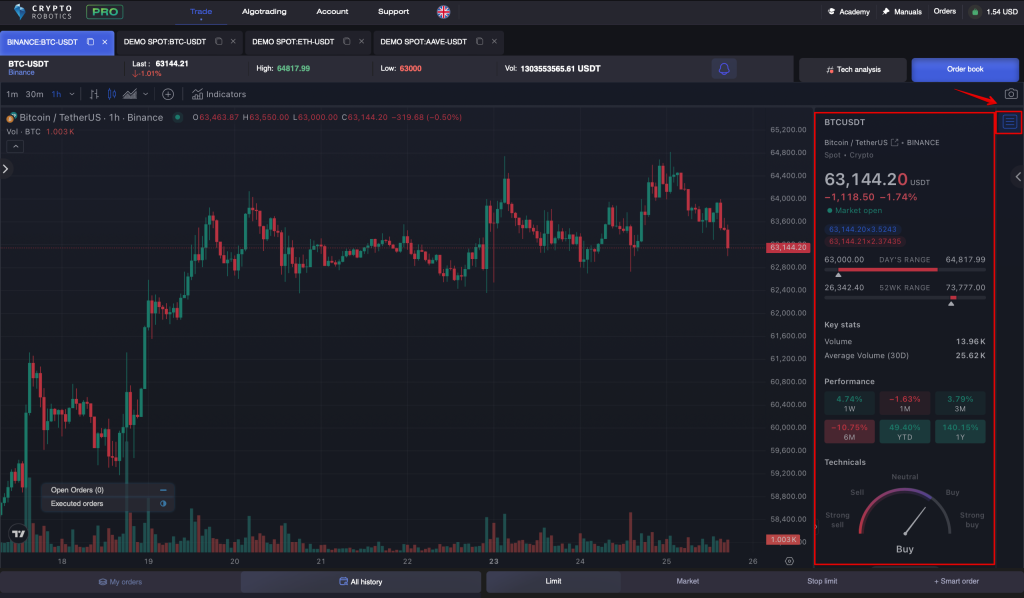
When clicking on it you can use the additional tool for analyzing the Order Book ( prices and volumes) for selected currency pair.
In there you can find an additional tool if you click on “More” button.
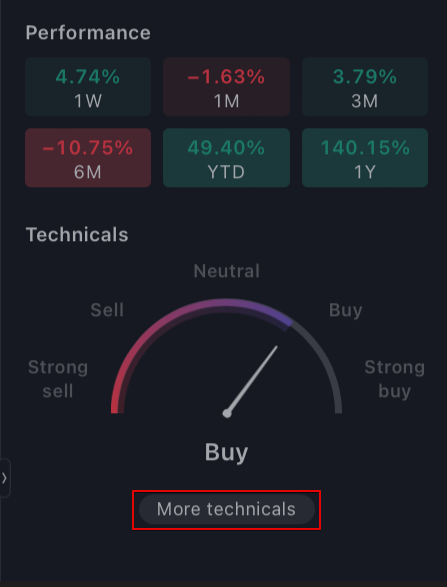
This tool is developed as integrated technical analysis based on more than 30 indicators and oscillators and gives tips on buying and selling a particular asset.
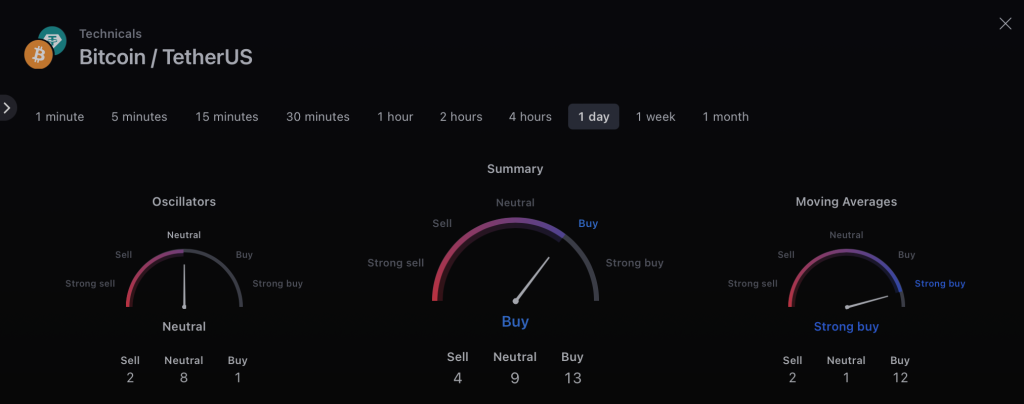
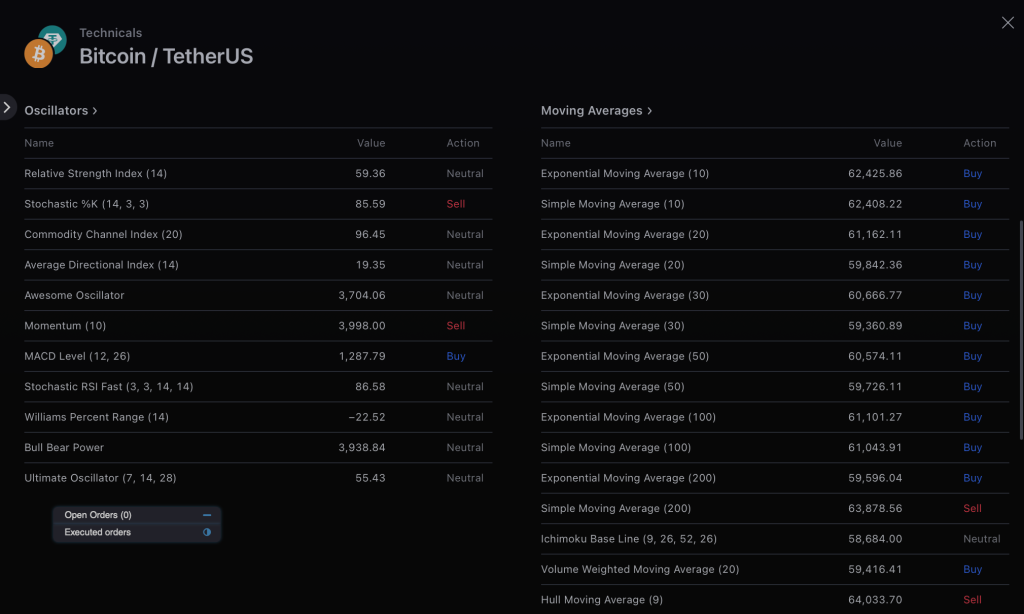
We recommend you to use this tool when searching for points to enter and exit the exchange.
To conduct a technical analysis of the market you need to switch to a particular mode.
If the button is green the tech.analysis mode is on, if red — off.
In this mode you are able to use most common technical analysis tools, an unlimited number of indicators and can save your work for later use.
Let’s take a look at all tech. analysis tools available for you.
LEFT MENU — Graphic analysis tools
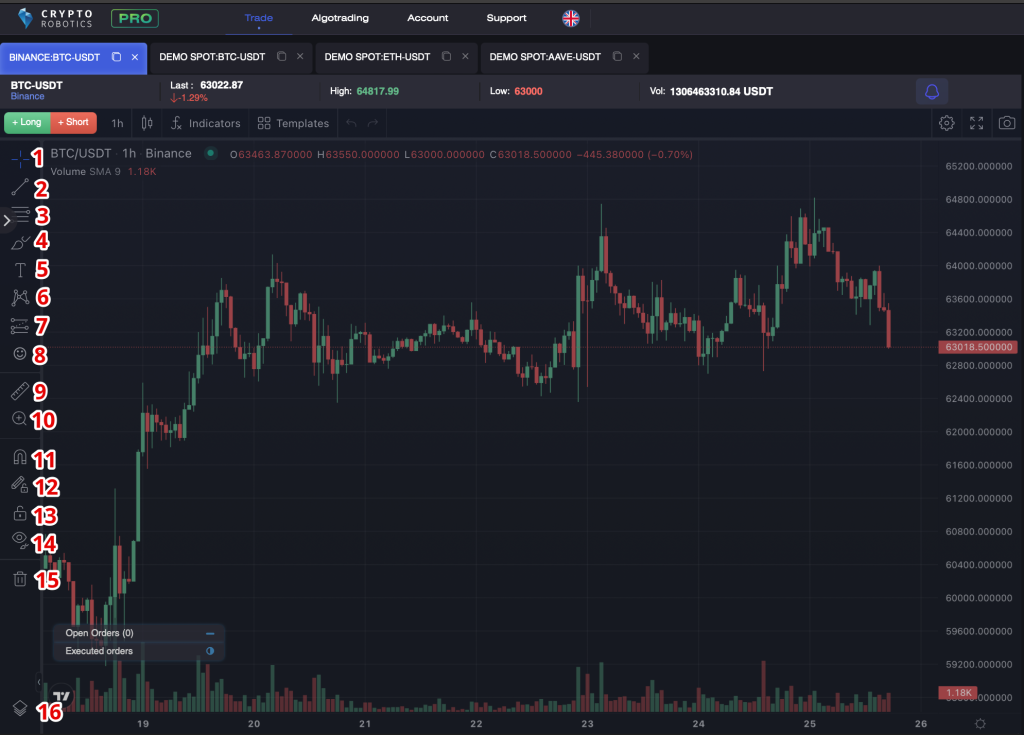
Tools are on the left side bar, 16 in total:
- Selecting the way the cursor is displayed — as a cross, a point, an arrow, an eraser;
- One of the basic elements of technical analysis is the lines: horizontal, vertical, rays, trend lines, arrows, channels, etc.;
- Graphical tools: Shiff pitchforks, Gann fans, Fibonacci figures;
- Tools for painting: triangles, rectangles, ellipses;
- Text tools: footnotes, notes, arrows;
- Patterns, templates, Elliott waves and loops;
- Tools for making predictions and risk miscalculations: short, long positions, date ranges, prices, projections, etc. ;
- Different icons;
- You can measure various parts of «TradingView» chart;
- Scaling;
- Magnet that allows you to attract points of objects to the closest prices. You can choose a strong or weak magnet;
- «Stay in painting mode» button;
- Fixing all objects;
- You can hide / show all painted objects;
- Trash bin — you can delete graphic objects;
- Object tree.
UPPER MENU
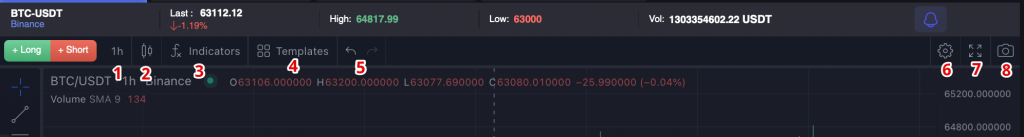
- Timeframe (one candle, bar interval);
- Bars types;
- Chart features (display settings);
- Indicators and strategies;
- Adding another currency pair to the chart for comparison;
- Chart step back;
- Chart step forward;
- Open chart full-screen;
- Make a screenshot;
- Download chart from Saved;
- Save chart to Cloud for further usage.