Open orders displayed on the chart
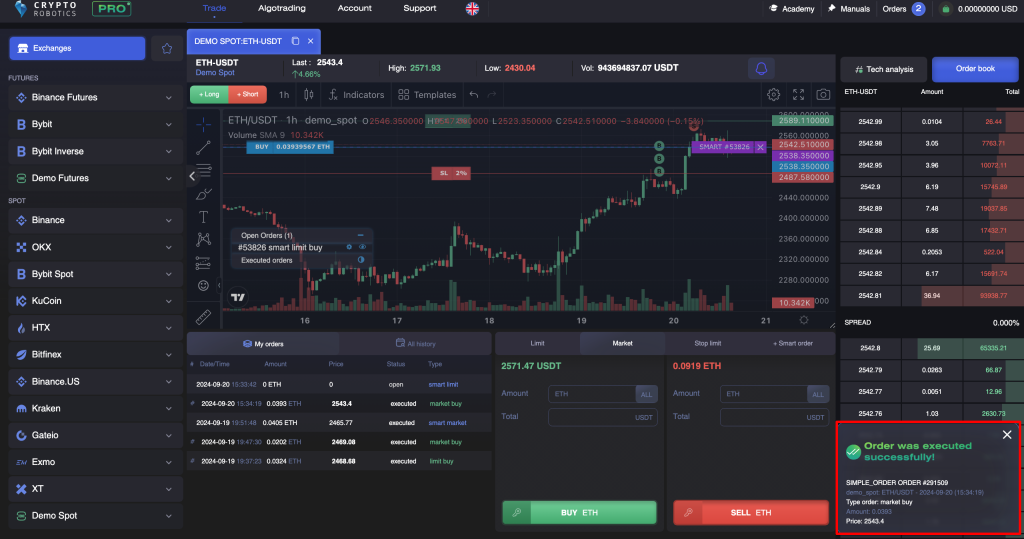
When buy and sell orders are set on the chart a grey line appears with the price and the quantity for this order.
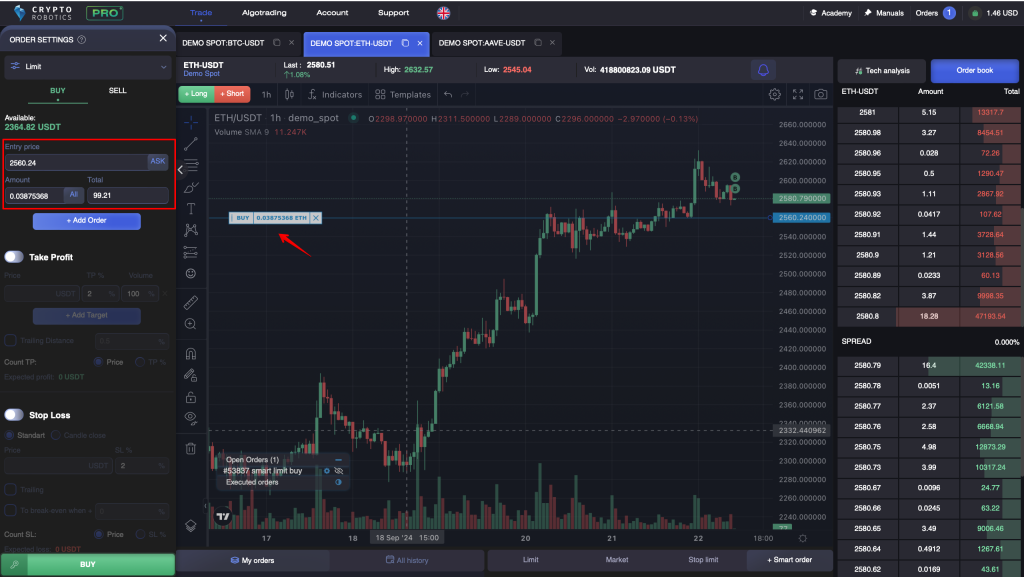
The order value can be changed by holding and moving the widget right on the chart (up and down) until it is set to trading.
After you click on BUY the order will be set to the Order Book. After that the widget color will become blue.
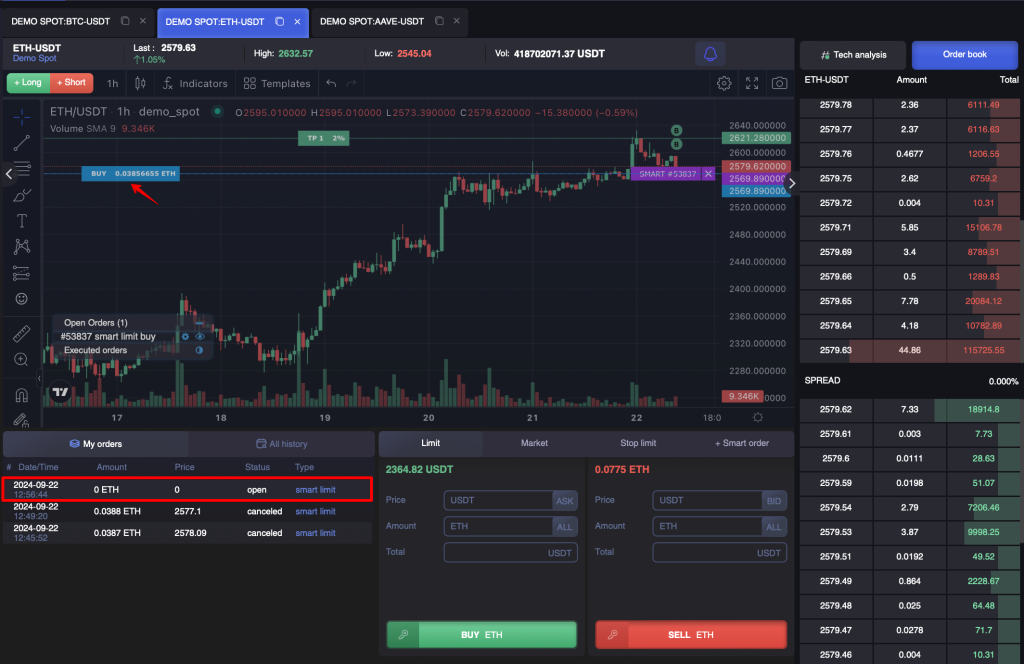
You can cancel this order clicking on the cross on the right side of the widget. When canceling order you see the error in the terminal it means that your order is already in the execution.
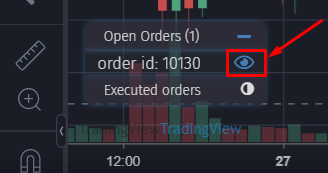
If you want to hide this order from the chart use the block in the bottom left bar. You can hide the order with one click and open it on the chart with another click.
Stop Loss and Take Profit (smart orders) displayed on the chart
We’ve added shortcuts Buy/Sell on the left side of the chart. When clicking on Buy you will see the window with settings for buy smart order on the left side.
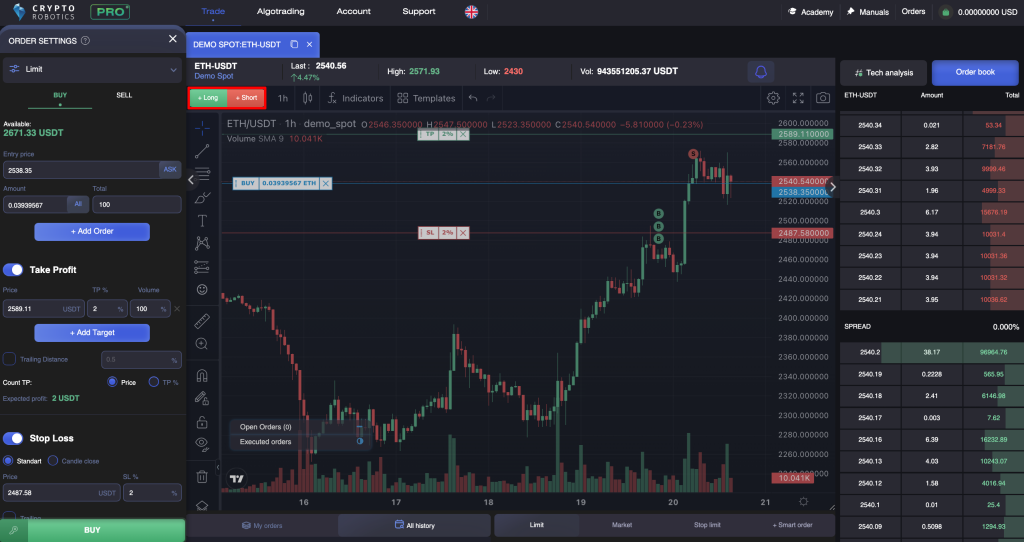
When setting the parameters for BUY, Stop Loss and Take Profit for this smart order all these values will appear on the chart.
Now any parameter can be edited not only on the left block but also by moving the widget up and down.
After you click on BUY the order will be set in the Order Book.
When buy order will be executed you will get the notification.
Next you can manage the settings of the smart order right from the chart. The left side of the widget You can move the order up and down with holding the mouse on the left side of the widget. When clickling on the middle block you will open the smart orders parameters. The smart order will be canceled if you click on the cross.

When clicking on the middle block or moving the widget you will open the window with the parameters for the smart order. Here you can see all of the parameters of the order, change its settings and panic sell by clicking on Sell.
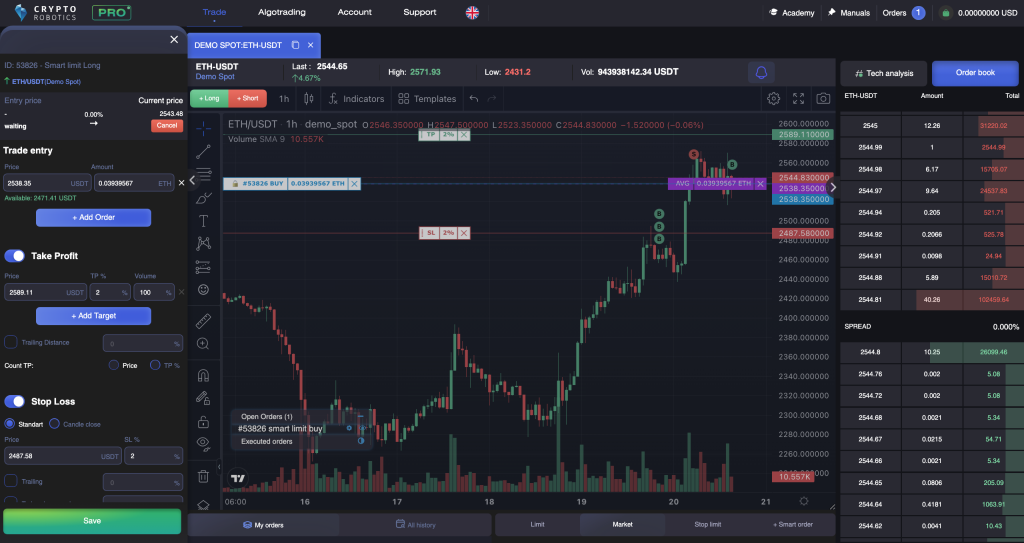
If you have changed the order parameters do not forget to click on the blue button — Save changes.
Close orders displayed on the chart
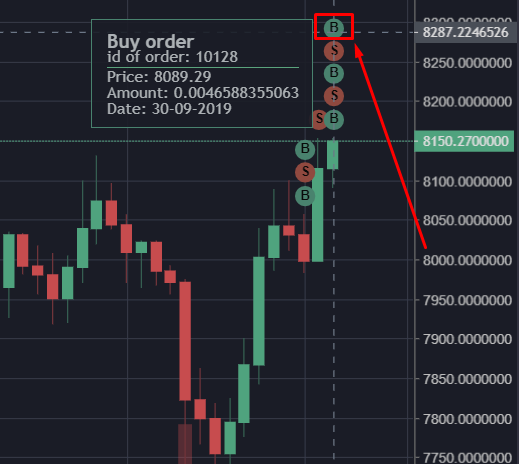
After the orders are executed they appear on the chart as bubbles with S (Sell) and B (Buy). If you hover the mouse over them you can see all information about this order: the price, the quantity and the date of execution.
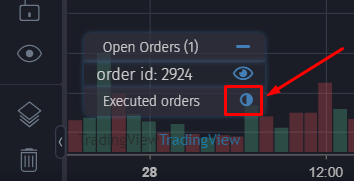
These icons can be hidden from the chart and opened up with one click at the bottom left side on the chart.
Easy monitoring and management of all smart orders from one platform
To see all of your orders go to Orders tab by clicking on the button on the upper right side of the terminal.
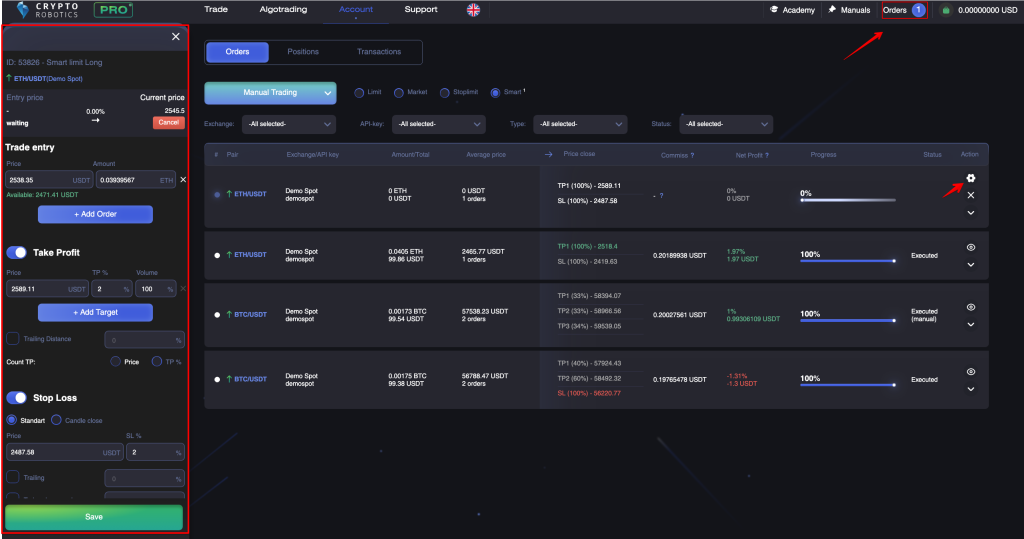
After that click on smart orders and the terminal will display them in one block where you will be able to manage them.
When clicking on the gear the settings block will open with the information for this smart order where you can change the settings and panic sell it clicking on Sell.
If you want to open the chart for this pair click on the blue note on the left side.
