We are ready to answer questions that have long been of interest to you:
- How can I understand what bot to choose and when to launch it?
- What settings will be most effective at the moment?
- Can I see the trading statistics of the bots?
We’ve created TOP statistics dashboard and are glad to announce its release.
With TOP statistics you can see where the market liquidity goes to (ALT-BTC, ALT-USDT, ALT-ETH, BTC-USDT) and what settings are the most profitable for today.
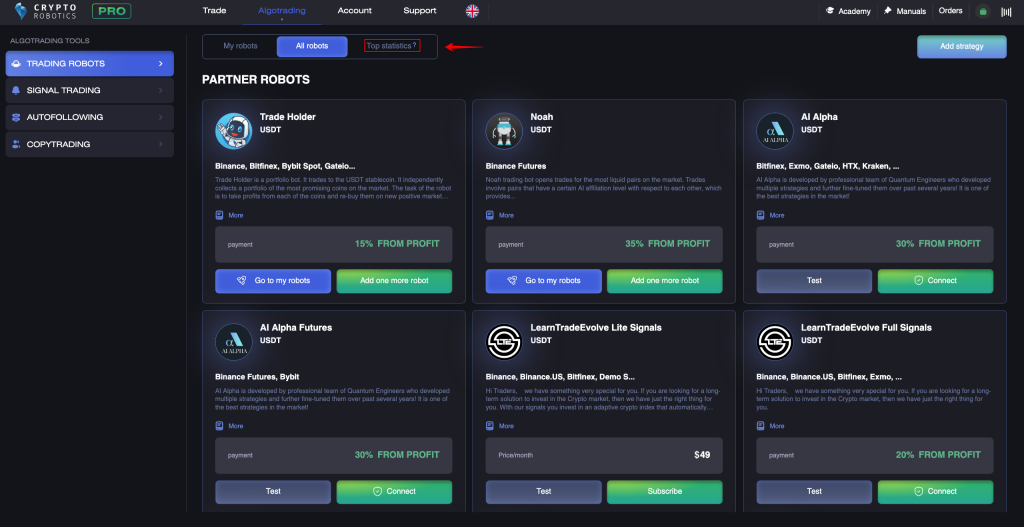
TOP statistics is the rating of profitable bots, and each user can view detailed statistics of their trade.
Here you can see the bots that have a positive trading dynamic on “open-close” orders for a chosen period.
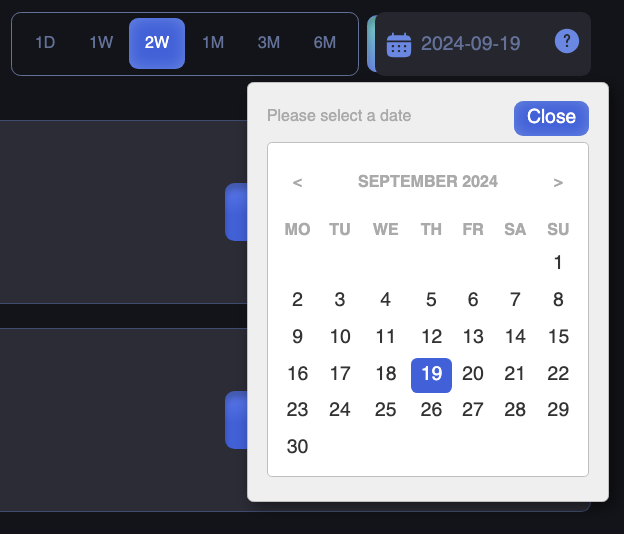
In the dashboard you can filter the bots based on time periods:
- 1 day,
- 1 week,
- 2 weeks,
- 1 month,
- 3 months,
- 6 months.
And also you can choose any date that interests you and watch the rating for this particular day.
If you select 1 week and then select a date in the calendar, the dashboard will show bots with positive dynamics of trading for the week (the last day in the week will be the date you selected).
You will receive full information about the trading of each bot: the exchange, the balance of trade, the number of closed orders, the total profit in % and the number of coins.
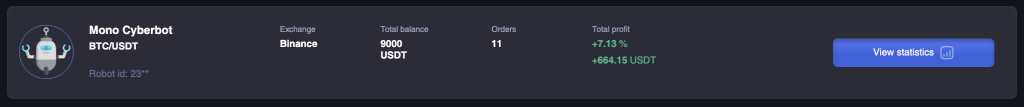
You can open a detailed statistics for a particular bot by clicking on View statistics.
After you click on this button the platform will provide the detailed bot statistics and its settings.
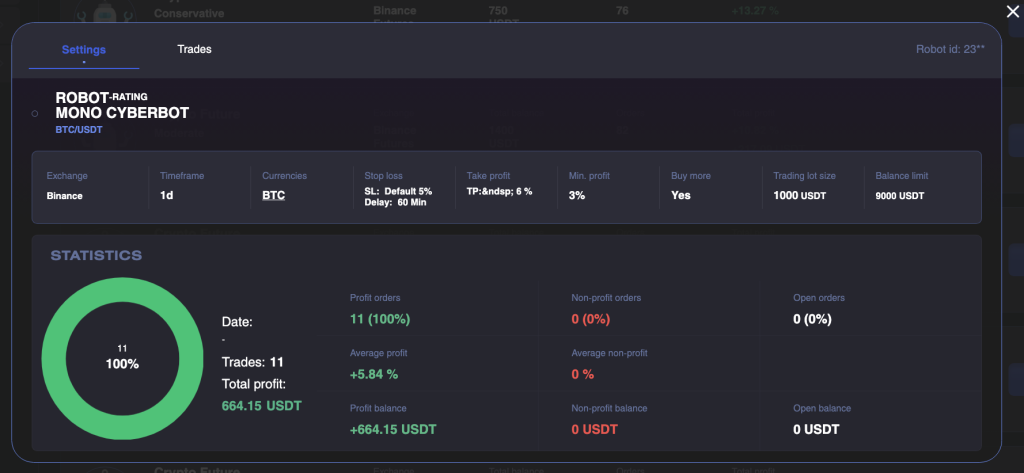
You can open and analyze all orders of a particular bot.
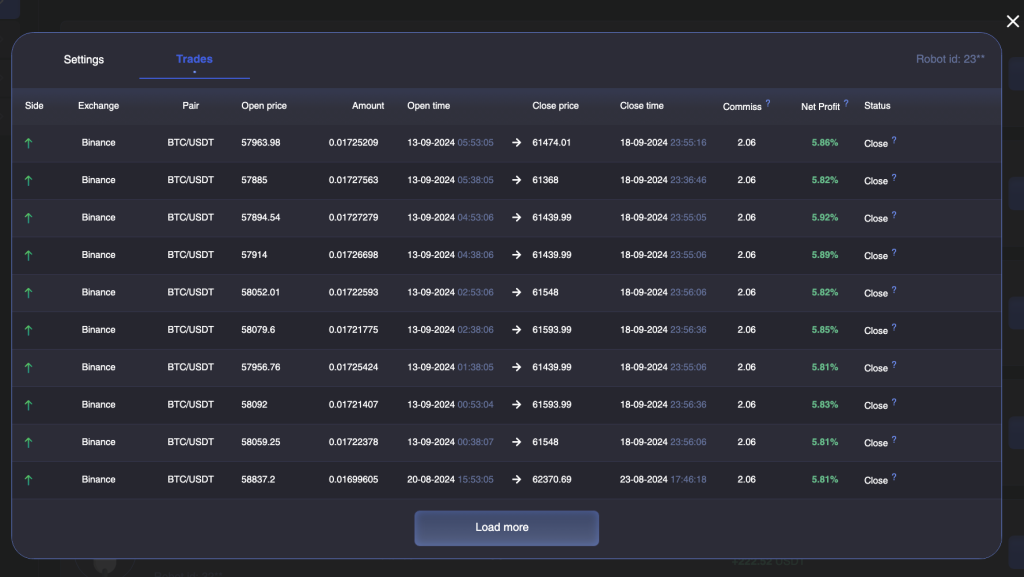
Please note that the results in the Top statistics section are relevant for the period of time for which they are displayed.