This service gives you the opportunity to follow the signals of analysts in 1-2 clicks and observe their execution from a single interface.
Signal trading fully automates and simplifies the process of your trading, makes it more profitable and reduces the risks of drawdowns on deposits.
Let’s take a step-by-step look at how to use the service.
Go to CryptoRobotics terminal. Click on “Algotrading button” and choose “Signal trading” in the menu.
The terminal will show you a list of all channels (analysts) and performance statistics of their signals.
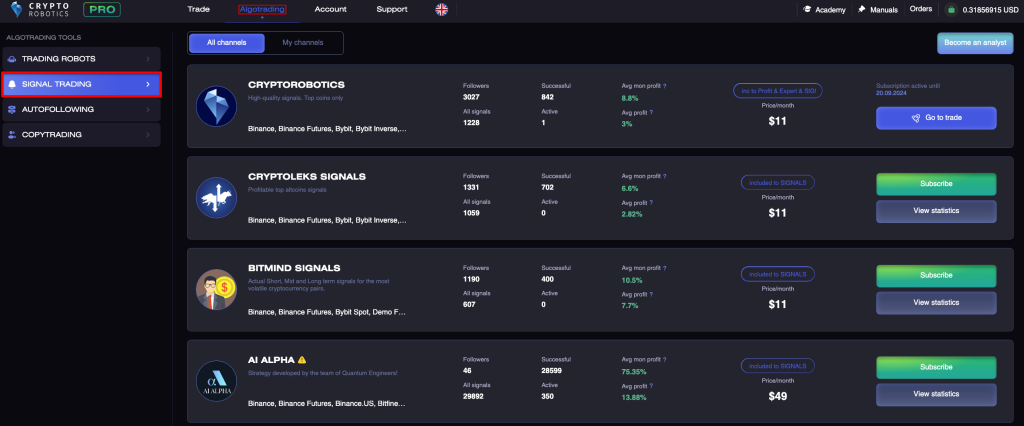
Above you’ll see two tabs:
- All channels — the list of all channels (analysts) that we have in our terminal;
- My channels — the list of all channels (analysts) you are subscribed to.
Let’s look at the information in the «All channels» tab.
Here you can find all the information for each channel (analyst), its trade statistics and the price of a monthly subscription.
Let’s look at the channel of one of the analysts in more detail.
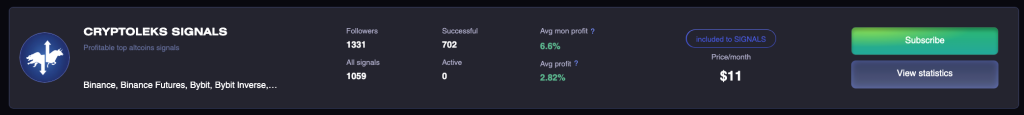
In the left corner you will see the name of the channel and its short description.
In the central block:
- Amount of subscribers;
- Amount of signals that are on this channel;
- Amount of current active signals;
- Amount of profitable signals (closed with profit);
- Average monthly profit in % (average profit per month);
- Average profit in % (average profit per one signal);
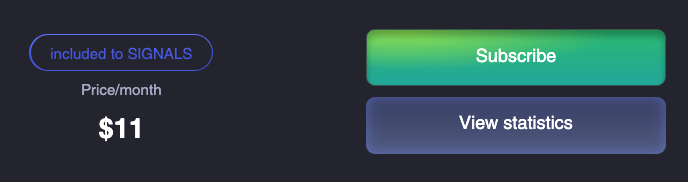
- Channel subscription cost per month.
The buttons are located on the right.
If you are not subscribed to the channel, you will see 2 buttons «Subscribe» and «View statistics».
To view the achievement of signals on the channel, click on the «View statistics» button.
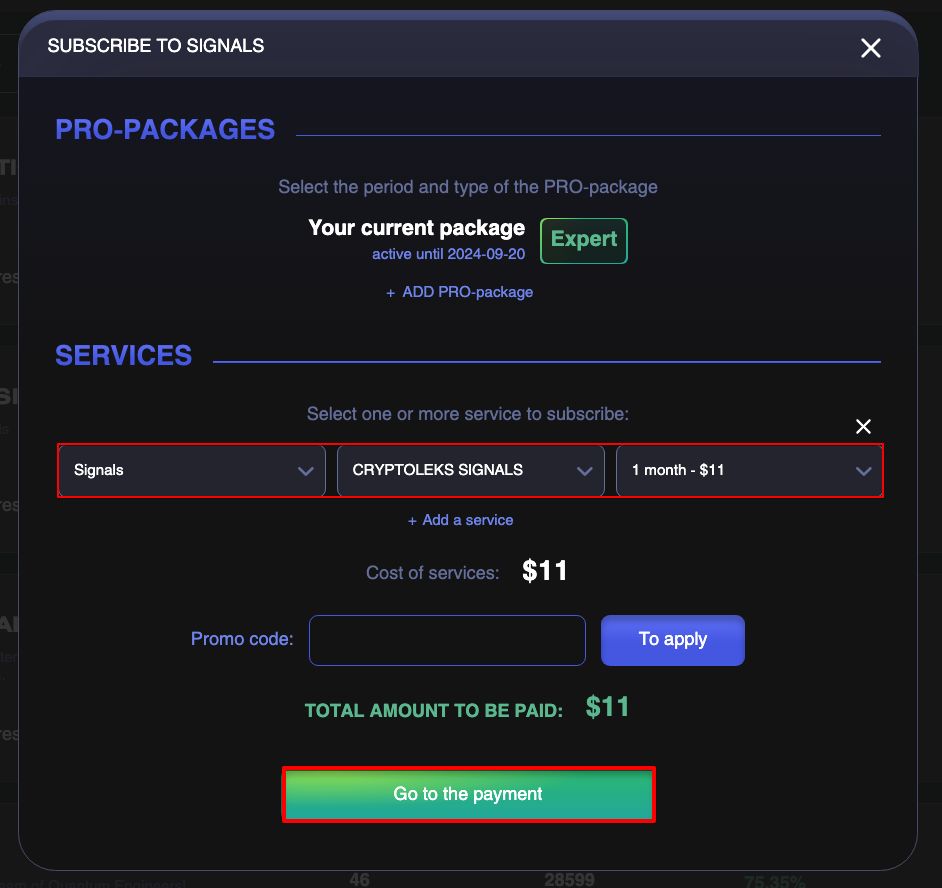
If you want to start trading on the signals of this channel, click on the «Subscribe» button to subscribe.
If you are already subscribed to the channel, you will see the validity period of your subscription and the «Go to trade» button.
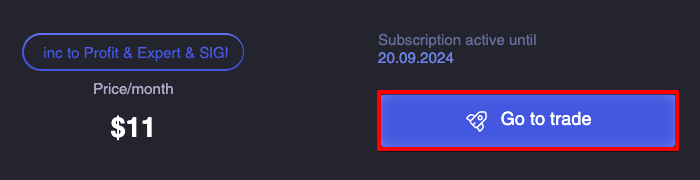
After clicking on the «Go to trade» button, you will be redirected to the page of this channel.
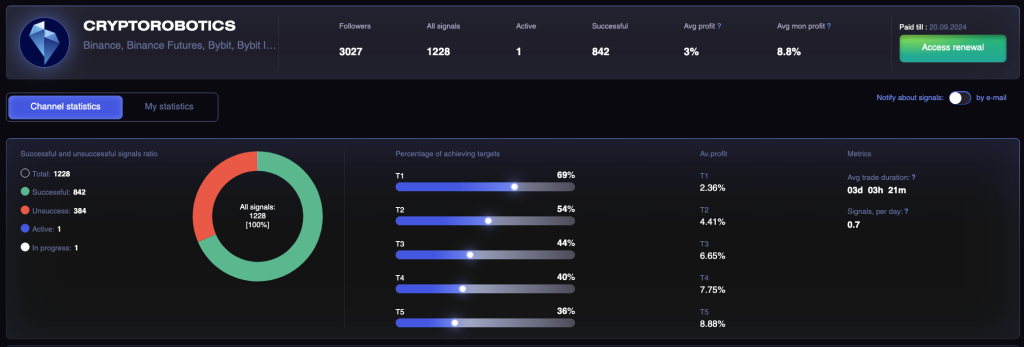
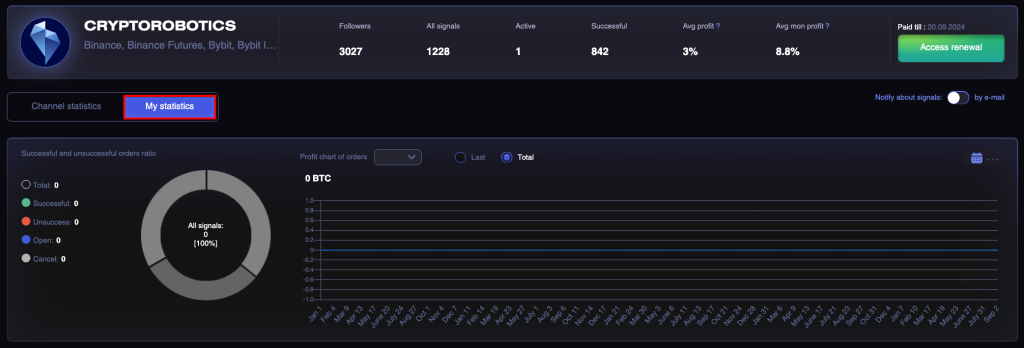
At the top you will see a brief statistics on the channel, as well as a button to extend access to it.
In the central block you will find more detailed statistics on all signals, the percentage of targets achieved, and the dynamics of profitability of signals of this channel.
Let’s start with the left block.
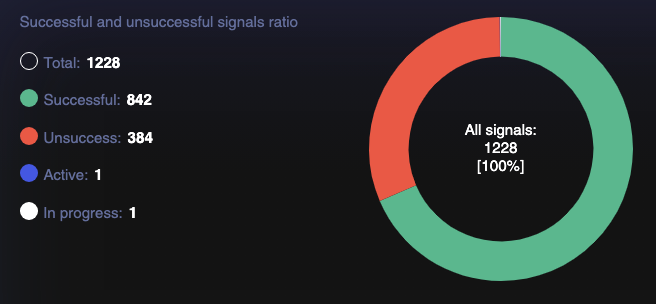
Here you will see the number of all signals that this channel (analyst) has posted, as well as the number of successful, unsuccessful and relevant signals.
In the center is a block that displays the percentage of achievement of each target.
This block displays the average % of achievement for each of the targets that the analyst set.
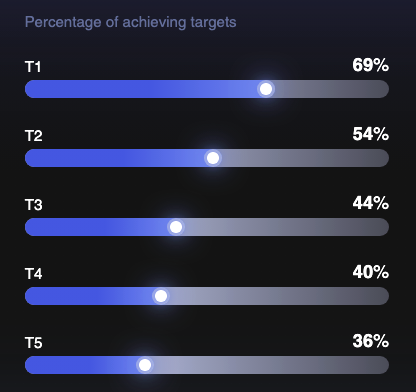
The analyst posts a signal with the targets of taking profit. For each signal, one or more targets will be given (T1, T2, T3 …).
If we take this example, the diagram shows that the target T1 was achieved in 70.97% of all data signals by this channel. Accordingly, T2 in 48.15% and T3 in 34.62% of cases.
These statistics will help you correlate all the risks and possible profits, so that you can choose for yourself a strategy for following the signals (for each channel).
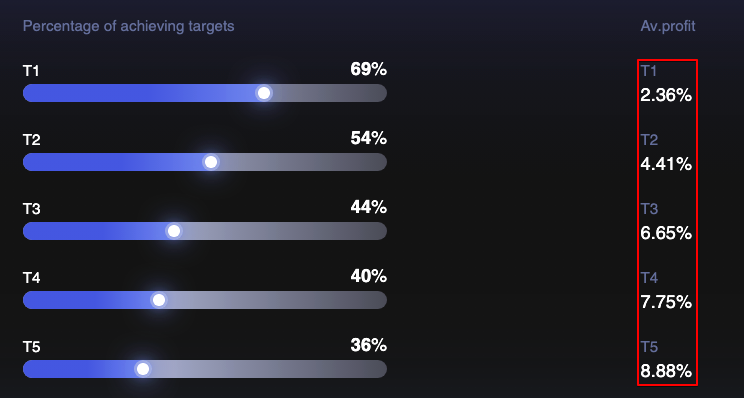
Next you will see a block showing the average profit for each of the targets provided.
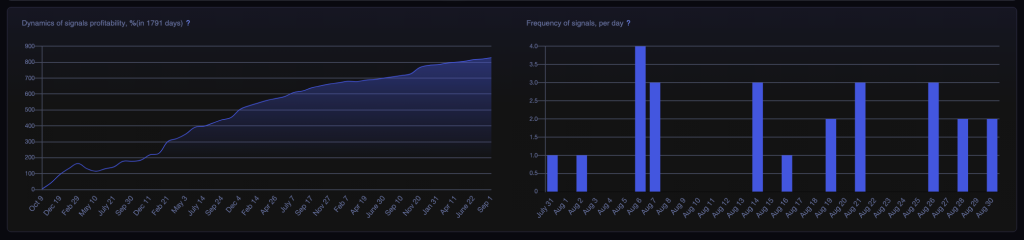
The left block shows the dynamics of profitability of signals in % by days.
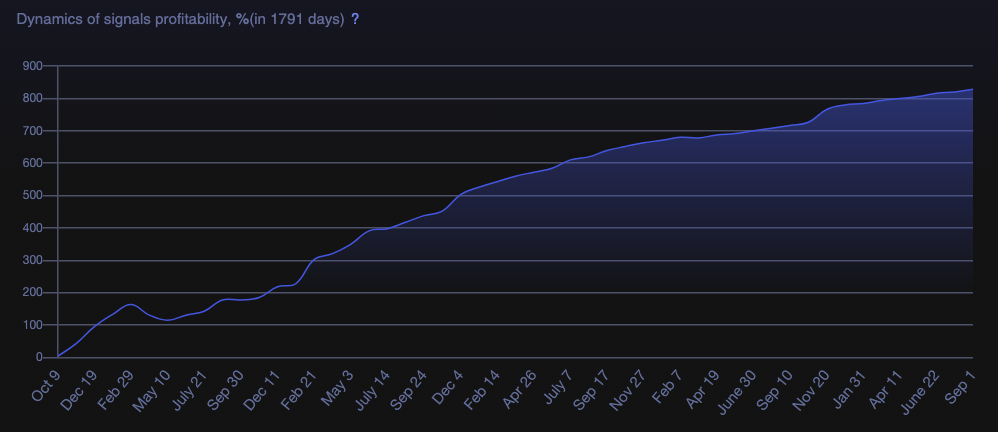
The chart shows the arithmetic average of all profits for targets that were executed on the specified date. Only completed targets are involved in calculating the profit margin of signals.
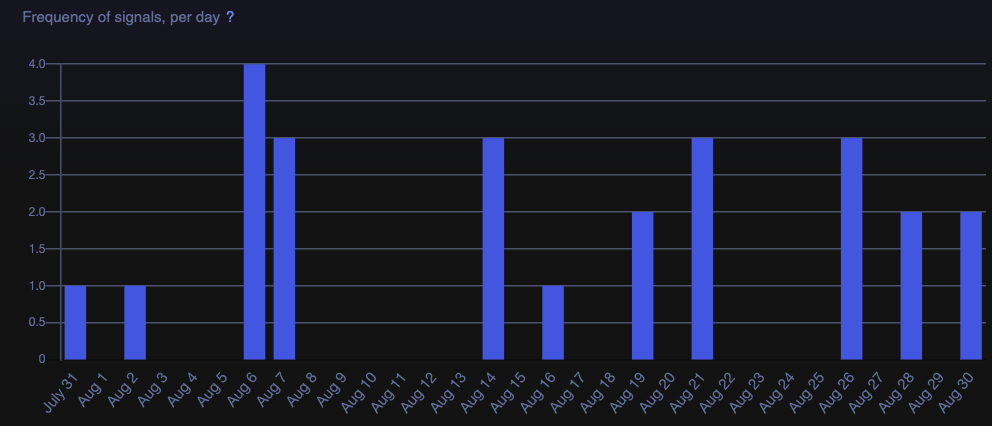
The left block shows frequency of signals. It shows the number of signals in the channel per calendar day.
You can also look at the statistics of your trading on the signals of this channel. All orders placed earlier by you (open, successful, unsuccessful and canceled) are added to the statistics.
Let’s move on to the bottom block now.
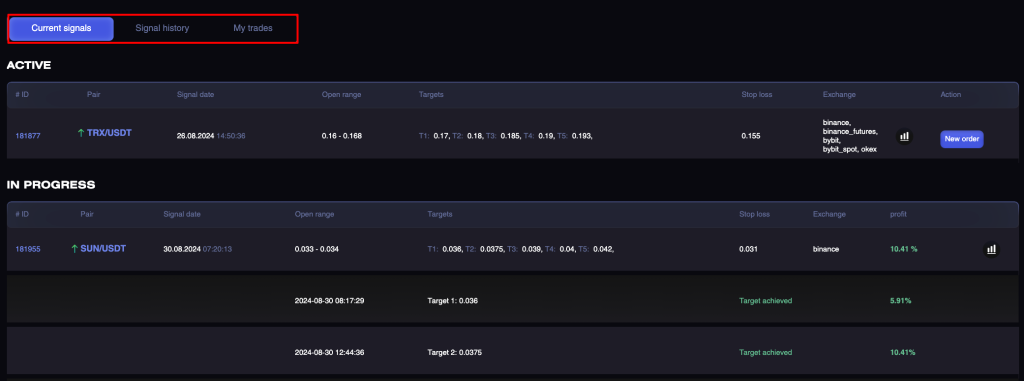
In there you’ll find 3 tabs:
- Active signals — signals for which there are still relevant entry points or signals in progress;
- Signal history — signals on which all targets have been hit or signals that have become irrelevant for opening trades on them prior to entry;
- My trades — the signals of the channel that you have entered.
Let’s first analyze the tab «Active signals».
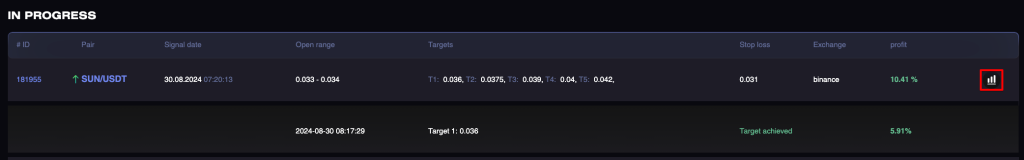
Here you will see a list of Active Signals that you can enter,
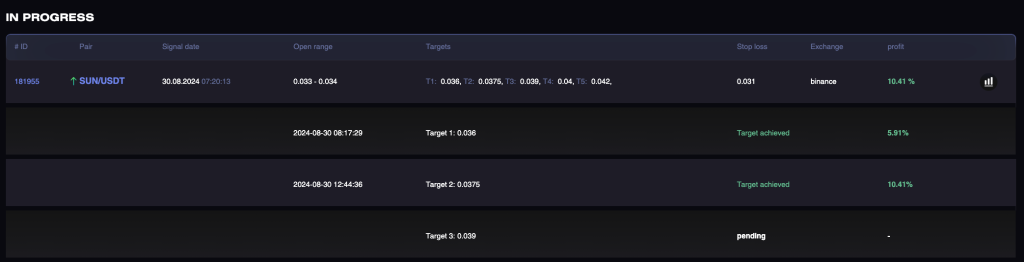
as well as signals that are In progress (at least 1 of the targets has been hit, but the signal has not yet completed its execution).
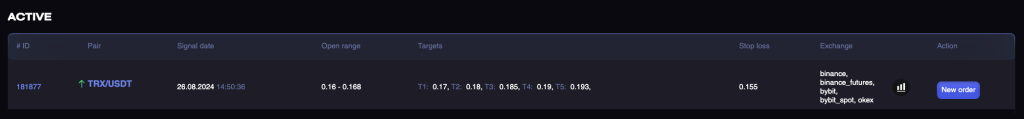
In the table you will find information on each of the signals:
- ID of the signal;
- Trading pair;
- Signal date;
- Buying range — entry points are indicated in the price range in which the analyst advises entering the signal;
- Sell target — profit taking levels;
- Stop Loss — allowable loss level on a signal;
- Exchange;
- Analyst comment.
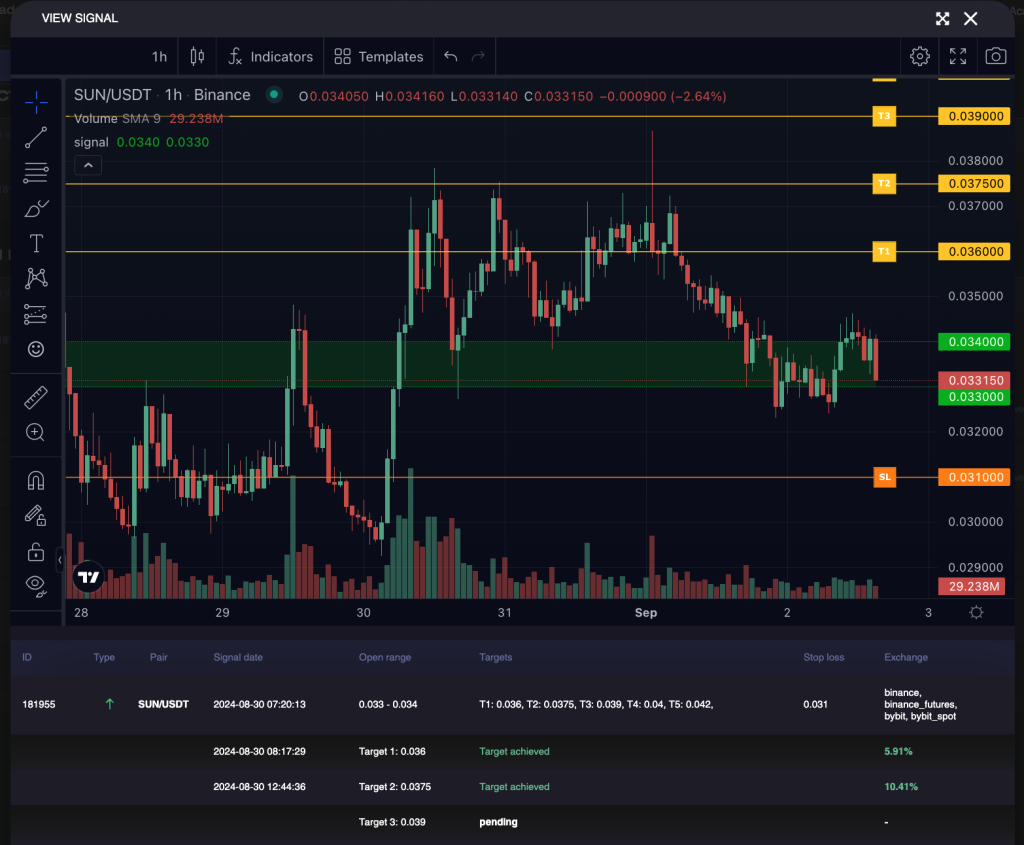
On the right you will find an icon, when you click on it, a chart will open with a visual display of the purchase range, stop-loss level and profit-taking targets.
In the Current Signals-> Active you can place a new order.
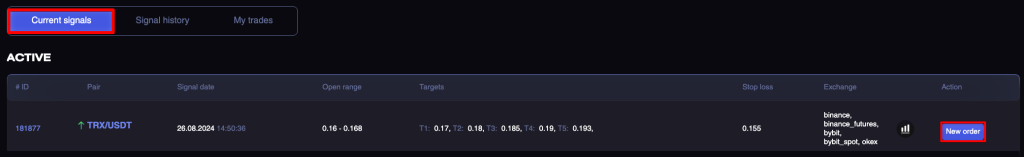
When you click on the «New Order» button, a form will appear with the settings to set up the signal.
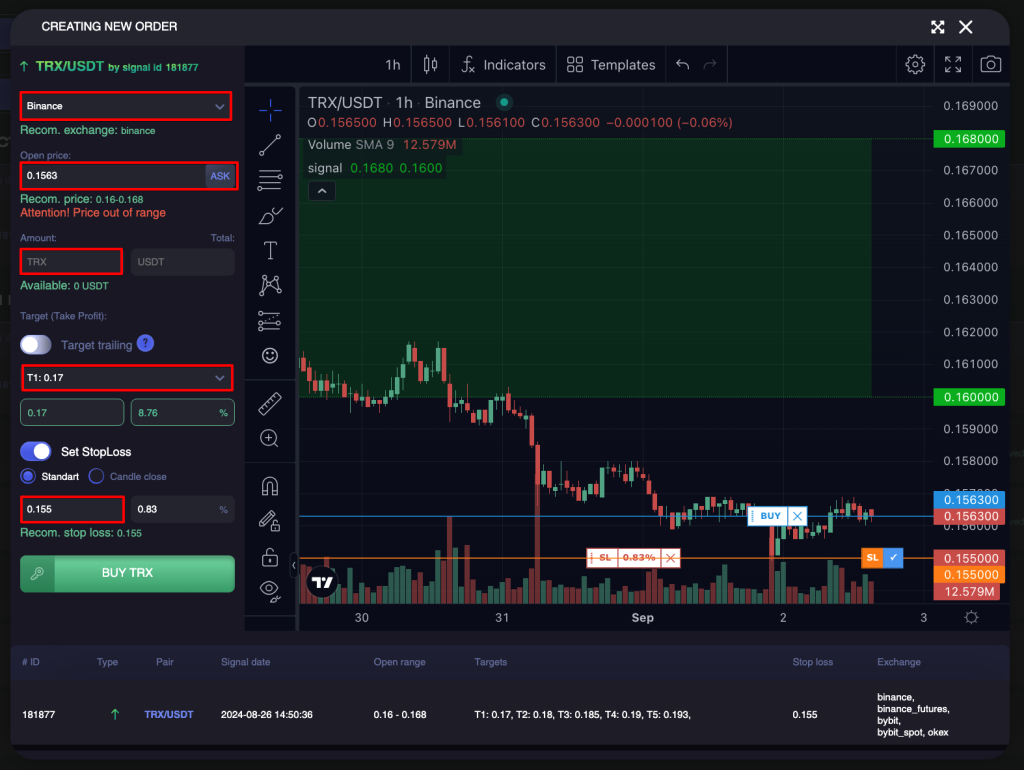
Parameters when creating a signal:
- Exchange — the exchange recommended by the analyst is selected by default (you can change it if you want) ;
- Buy price — the default price is the average value of the buy range (you can change it manually, pull up the price in the ask book or move it directly on the chart);
- Quantity — amount per order;
- Sell target — here you can choose an exit point (Take profit). Using selector choose T1, T2, T3 (defined by the analyst). You can also click on the checkmark in the graph opposite each target or you can select the target as you wish by moving the TP slider on the graph;
- Stop loss — the default is the stop loss specified by the analyst. You can set your own or deactivate it.
For experienced traders only:
Stop loss is also available for analysts and users with «Candle close» option. This type of Stop loss checks not the current price but checks the price at which the candle has closed for the previous period for the selected timeframe (1h, 2h, 4h, 12h, 1d).
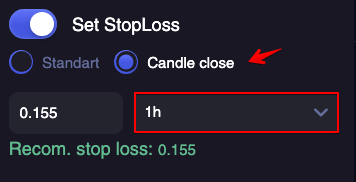
The preset indicator checks if the previous candle for 1h, 2h, 4h, 12h or 1d closed at a price lower than that indicated in the main currency.
Thus, the trader protects the deal from possible price fluctuations within the timeframe, increasing the chances to exit in Take Profit.
Before buying, you have the opportunity to choose the key version if you integrated several accounts of the same exchange.
After all the parameters are entered, click the buy button and the order will go to trading.
If you want to place several orders with different levels of profit taking (T2, T3 …), then go through the process of placing an order again.
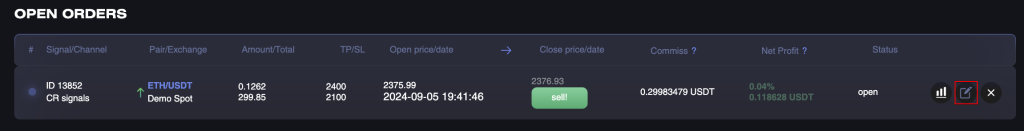
You can find the orders placed by you in the «My trades» tab.
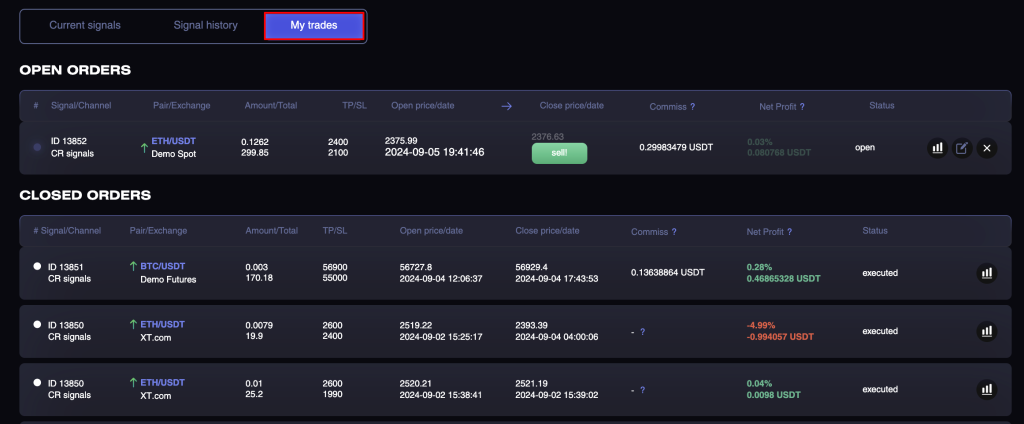
To see the details of your order, open it by clicking on the down arrow.
As soon as the coin is bought, you will have the opportunity to close it in manual mode, without waiting for the execution of the target. To do this, click on the «Sell» button.
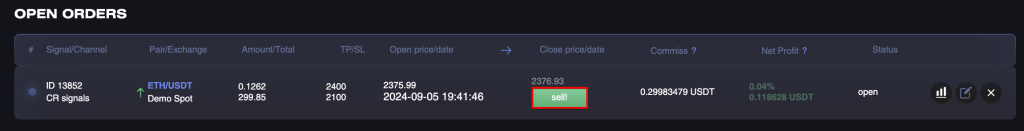
You can also change the order settings by clicking on the cog in the right corner.
A form will open with the ability to change data on Take profit (T1, T2, T3 …) and Stop loss.
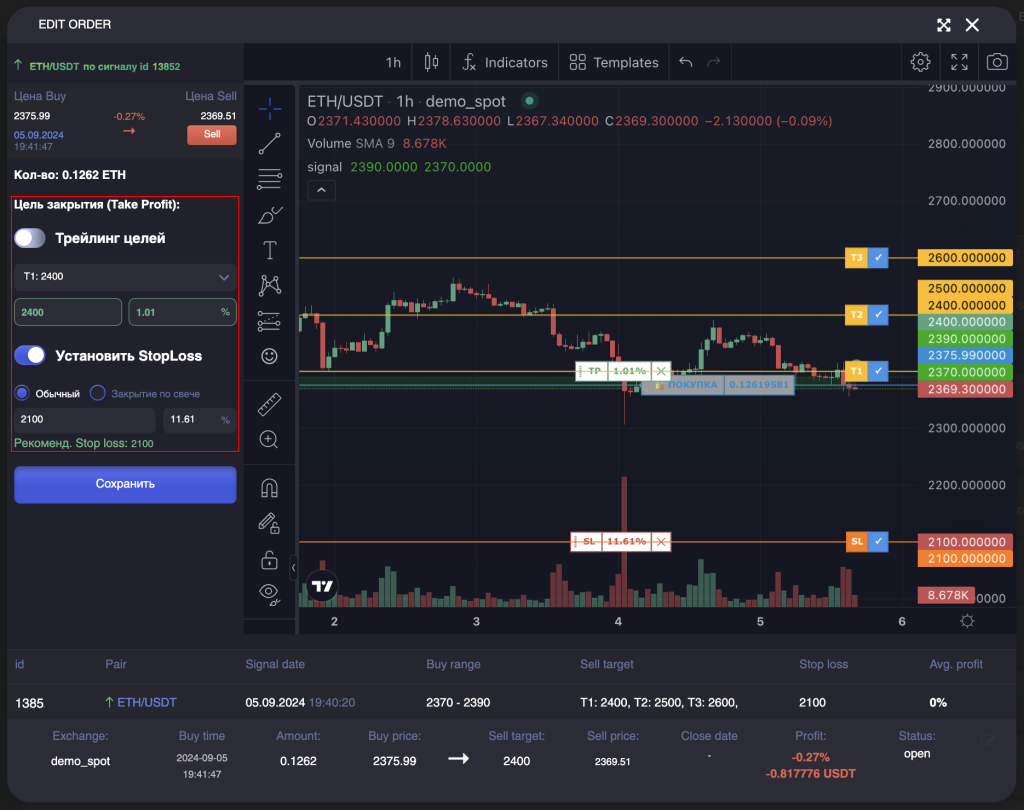
If buy order is still not executed here you can also change the value of Buy price.
After changing the settings, do not forget to click the «Save Changes» button.
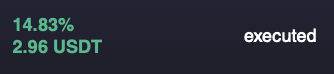
As soon as the exit signal works and your order closes, you will see the status «Successfully completed» and the percentage of profit on the signal.
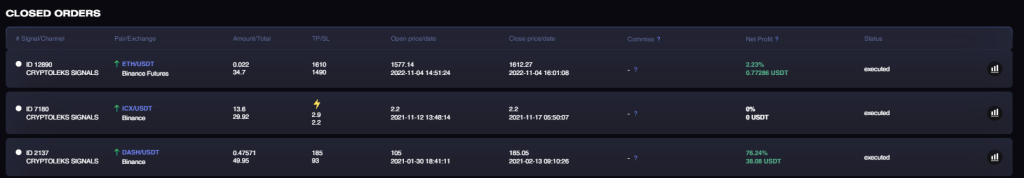
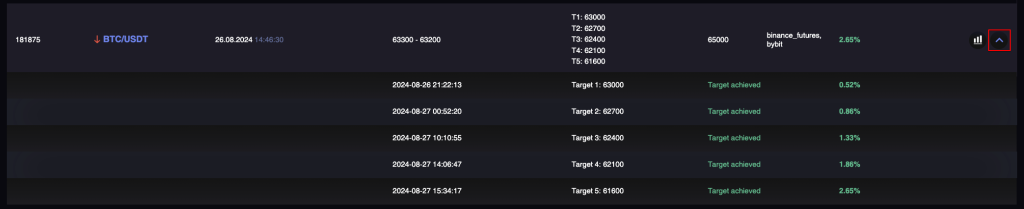
Now let’s look at the Signal History tab.
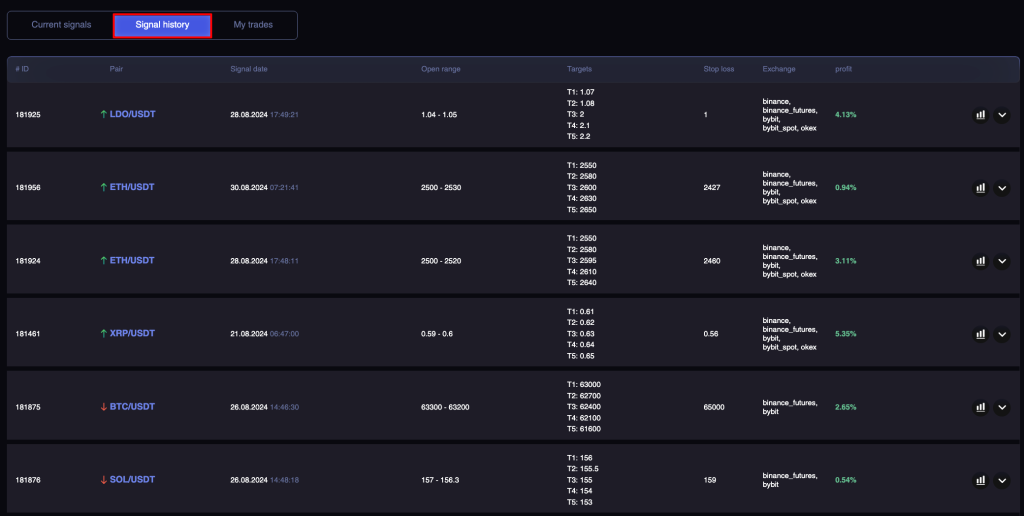
Here you will find signals that were previously relevant, but according to a number of conditions, have already been transferred to the archive (one of the targets has been reached, the signal has reached its lifetime, the signal has been manually moved to the archive by the analyst).
You can expand the details of each signal and see the dynamics of achievement for each of the targets.
In the «MY CHANNELS» tab, you will find the analysts you are subscribed to now and those you have subscribed to earlier.
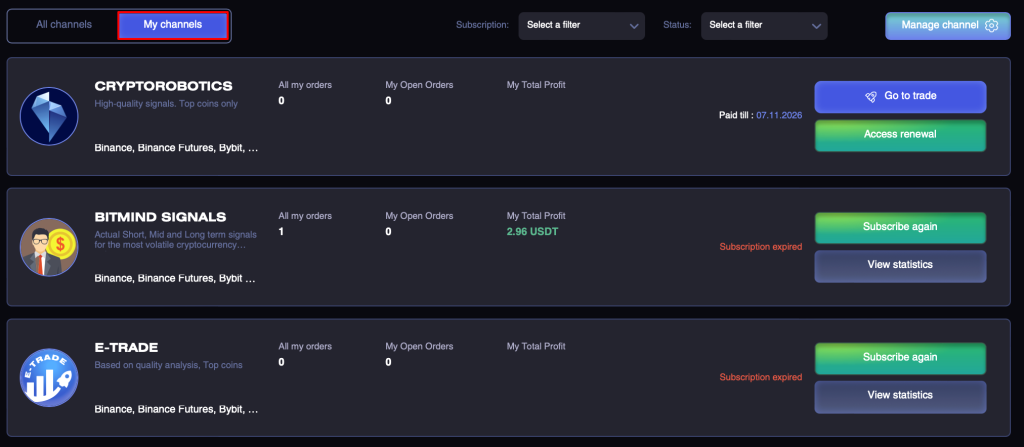
From here you can subscribe to the channel again, renew your subscription, and go directly to each channel.