This short guide discusses the issue of varying balance in cases when you keep funds in cryptocurrency (you can count in Bitcoin, since they are all well correlated), and when you keep funds in a less volatile currency (in dollars or more often in USDT).
If all your funds (or their main part) are in BTC:
In this case, the variation of balance chart displayed in both USDT and BTC looks logical:
- nothing changes on the variation of balance chart displayed in BTC;
- when displayed in USDT, we see that with an increase in the BTC price, the balance grows as well, and with a fall, it is quite natural that the balance falls likewise.
If the funds are in USDT:
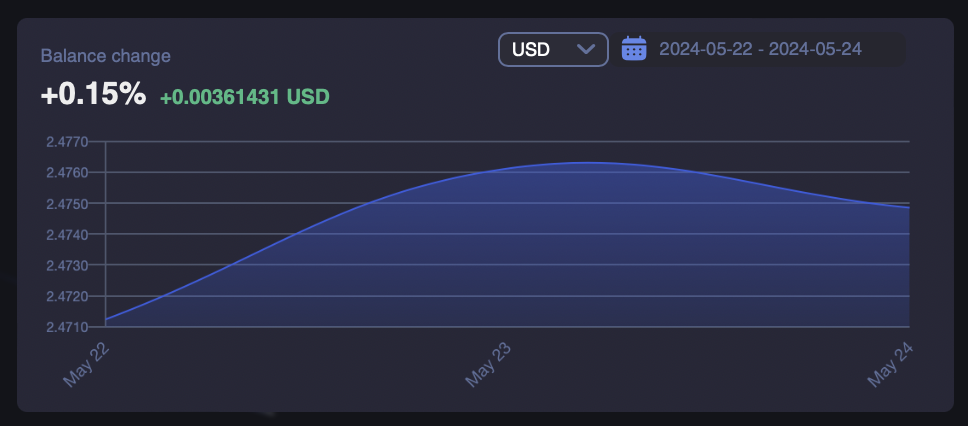
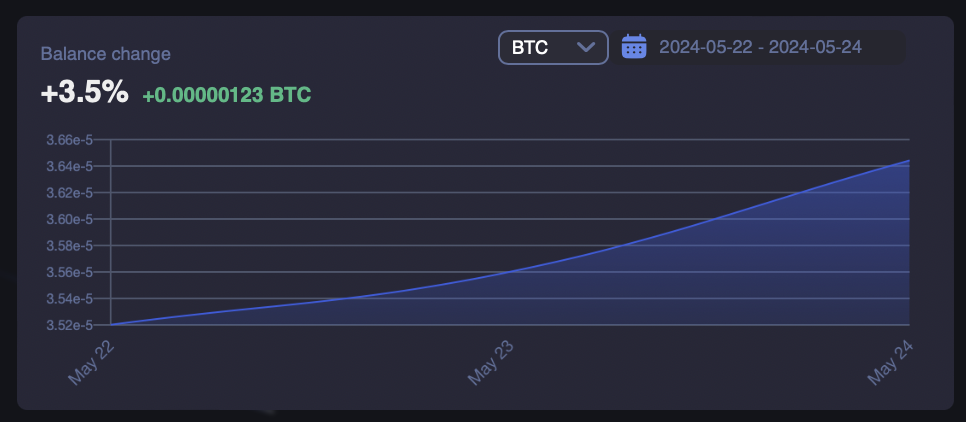
In this case, we should see no changes on the variation of balance chart displayed in USDT, and on the chart displayed in BTC changes are opposite to the BTC / USDT rate. In other words, even whilst holding funds in USDT, we will observe a fall in the balance chart when the price of bitcoin rises, and vice versa, an increase in the balance when the price of bitcoin falls.
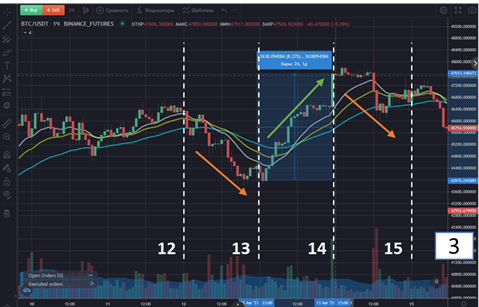
For a better understanding, consider the image below. In this case, the situation is presented when the main part of the funds is in USDT, and therefore we observe a small change in the balance chart (0.21%). At the same time, on the BTC balance chart, we see a slight increase on the first day (from 12 to 13), a sharp decline on the second, and then a slight increase again. At the same time, the bitcoin rate against the dollar showed opposite movements and what we see on the balance chart is more likely to be changes corresponding to the USDT / BTC chart.